Flink-ESB Integration Platform
Tools to develop and run applications in production
 Build complex processes with no programming experience. With Flink-ESB Editor you rarely needs to code something. All you need to to is just drag and drop the componenets you require onto editor canvas and set their properties. Start the application with just one click in the editor and test it by calling process in test view of the editor or in the Flink-ESB Admin Console
Develop "smart" applications using Flink-ESB, which can react to any internal or external events in any custom way. For instance, if database has a downtime, application would notice this and put only the processes interacting with this database into STANDBY mode, and reactivate them again when the database is available. The rest of application would continue working in usual mode
Application can automatically activate maintenance page in case some backend systems are not reachable, and deactivate it when those systems are back. For the flows that do not communicate with that backend, no maintenance page will be shown, they would continue working normally
Use project variables to specify environment specific or any performance relevant parameters in external properties file.
Adjust those properties according to your environments and performance requirements
Develop several projects at the same time, start them in the Editor by just clicking one button. Applications started within Editor behave the same way they would behave in Runtime Environment, and interact with other running instances
Test started applications either using "Tester View" in the Editor, or using Flink-ESB Admin Console, which would show you the applications exactly the same way operations team would see them when they are installed in production environment
Run any kinds of tests by just starting applications in the editor. Use Flink-ESB Admin Console to get information about application performance
Be able to get information about application health in just 5 minutes and that is without any programming experience or previous experience with Flink-ESB
Save your time and resources by having Flink-ESB AdminConsole analyze the applications and provide you detailed information on what should be improved
Flink-ESB Editor is the only tool you need to develop different kinds of applications. You don't need to install any other software, like Web- or Application Servers
Many components are available out of the box, allowing you to design applications with processes of any complexity. In most situations no coding at all (and hence no programming experience) is needed to create an application and design all its routes
You can develop several projects at the same time using the same Editor. You can start them, check the functionality, try integration with already installed applications
Flink-ESB Editor allows you to test every part of the project
If you code java classes and define them as beans in the project, you can start the project and call every
method of such beans, try different arguments, and see whether they return what you expect
Try calling Routes using different payloads, properties and headers
Flink-ESB Editor comes with preinstalled Flink-ESB Admin Console. As soon as you start one or several projects in the Editor, you can use Admin Console to verify behaviour of routes, route templates, resources, beans, bean templates and services in all started projects
Projects started in the Editor behave exactly as applications installed in Flink-ESB Runtime Environment. Test interaction with other applications. See how application reacts on different internal or external events or outages. Simulate outages or mistakes to verify application's behaviour
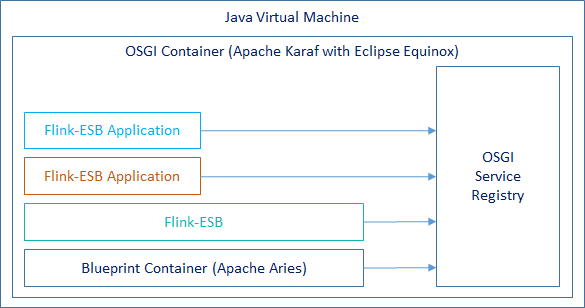
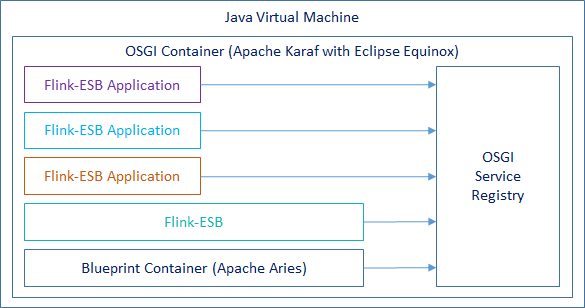
Add / remove any number of Flink-ESB applications at any time without restarting Flink-ESB instance
Restart Flink-ESB applications without restarting the instance
Upgrade Flink-ESB application to a newer version without downtime
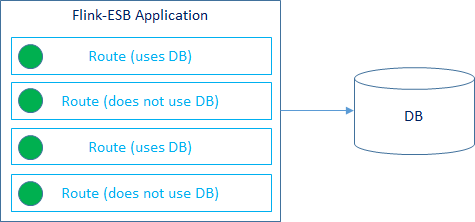
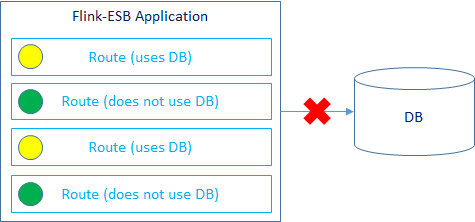
Routes can be defined in a way, that they react to one or multiple events
Event can be anything: change in backend connectivity status, TCP connectivity status, HTTP connectivity etc.
For example if some routes use DB, they will be put to STANDBY when there is no connection to DB, and will be activated when connection to DB is reestablished
Flink-ESB Admin Console is automatically installed with any runtime instance of Flink-ESB. It is also a part of Flink-ESB Editor
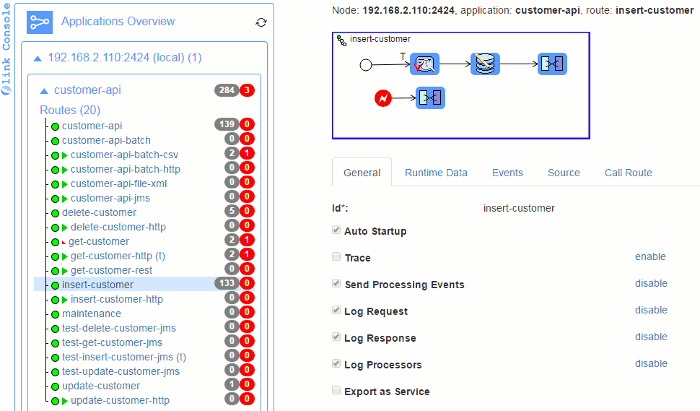
Check runtime statistics of all Flink-ESB instances within a cluster. Just click on any cluster instance to see runtime statistics per application
Click on any application to expand it. On displayed menu click on "Routes" to see runtime statistics per routes within that application. View number of times every route was called (in grey badge) and number of failures (in red badge)
Find out within seconds what routes in what applications have errors
Use "Filter" menu to specify start and end timestamps for displaying runtime statistics
Click on any route to view it graphically. This shows you the route exactly the same way it is shown to the developer in Flink-ESB Editor. Click on any component of the route to view its properties
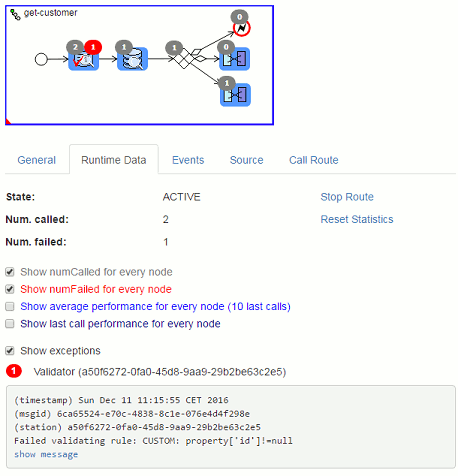
Select "Runtime Data" tab to see more details on runtime statistics of the route
Select checkboxes shown on the picture to see runtime statistics per route node. Find out where exactly within a route the errors were thrown
Select "Show exceptions" checkbox (shown only if there are errors thrown within selected route) to see more details about every single error: timestamp of error, message id, error message. Click on "Show message" to see a full message that led to the error
Video tutorial: Check applications runtime statistics in Flink-ESB Admin Console. Find out what errors where thrown by the applications, check the errors and the messages
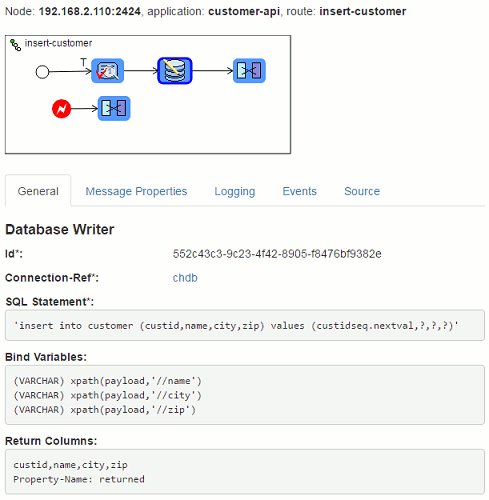
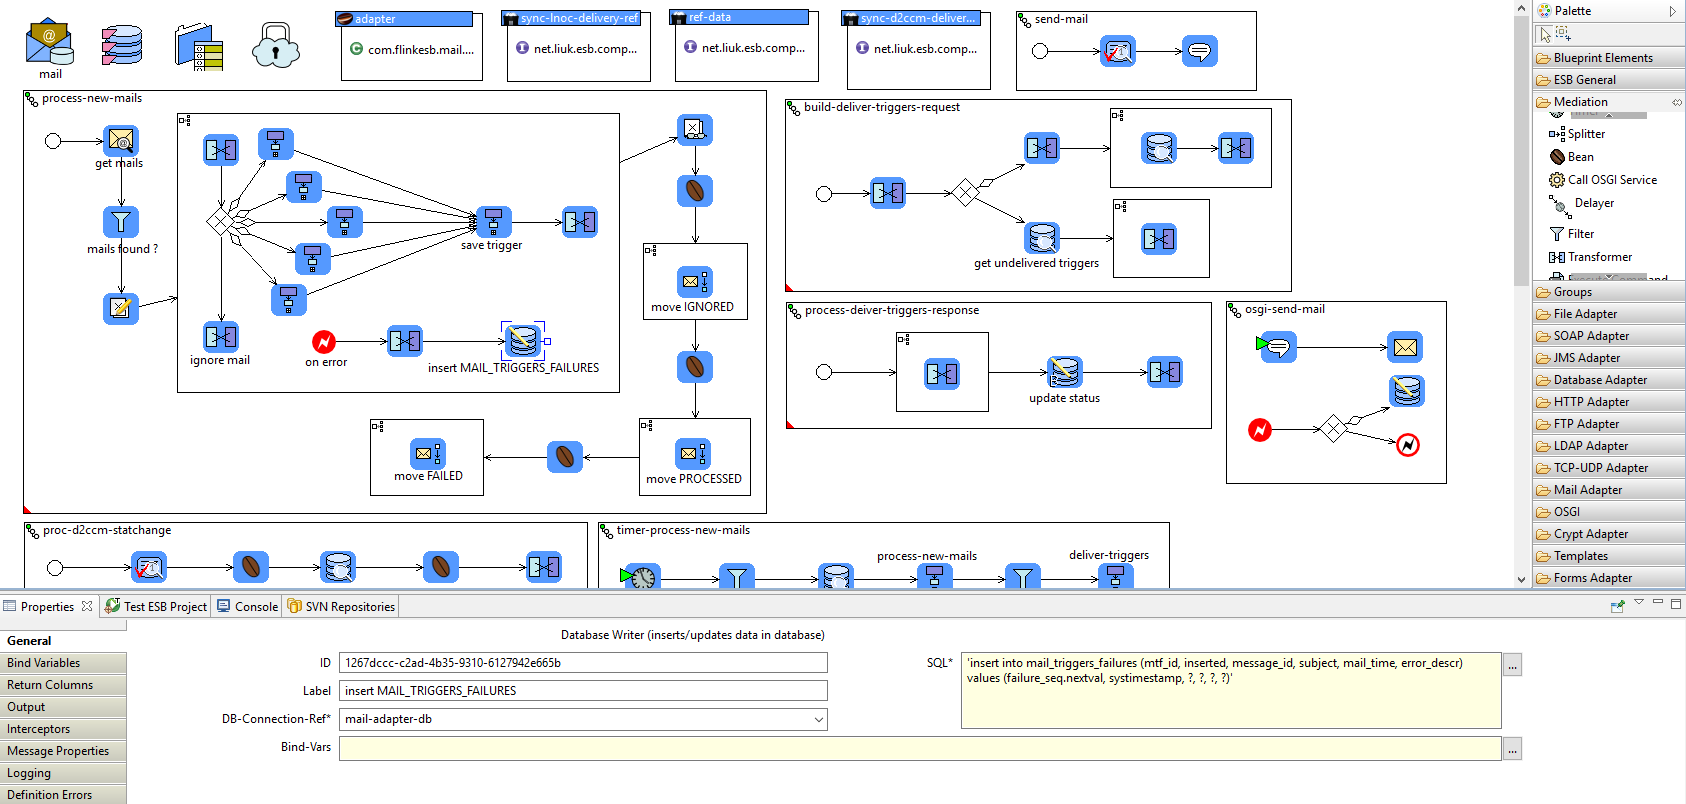
Click on any route node to see its properties
For example, click on "Database Writer" to see SQL statement, bind variables, return columns (if there are any) and other properties
Click on "Connection-Ref" parameter to see properties and runtime data of database connection, which is used for this route node
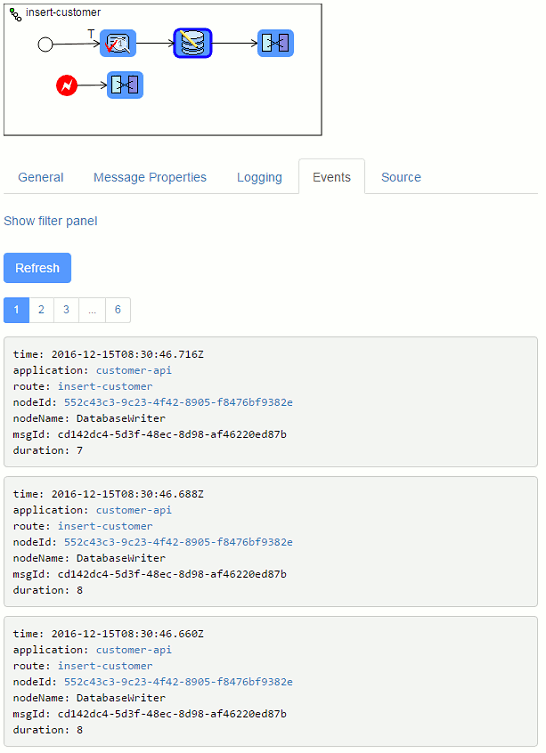
Click on "Events" tab to see runtime events for selected route node
Every runtime event contains information on timestamp, message id, application, route, route node and duration (in milliseconds). In case of error, whole exception stack trace is shown here
Select route and go to "Events" tab to see runtime events of the route and all of its route nodes. Select application to see runtime events of all routes which are part of this application. Select cluster instance to see runtime events of all applications, routes and route nodes runnig on that cluster instance
Use filter panel to sort out events matching a certain criteria. For example select events with duration >= 100 milliseconds
How we support principles of Agile Development and DevOps
It is often a problem especially for bigger companies, where many new projects are introduced into production, and operations teams do not really know what exactly all those new applications are doing. All they have are the log files, and if they are lucky, they can find some information there, provided developers did their job well, and applications log all their activities properly. In most cases they get incident tickets from the customers, stating they experience troubles using application XYZ. Application administrators try to search in logs, find nothing at all or nothing they can explain, send those logs to developers, wait for few days, and finally end up with the statement from developers, they cannot find anything in the logs, so there is nothing for them to fix
For managers, even if they realize that the vendor of the application XYZ is delivering very bad quality, they simply cannot afford to change the vendor, because it is extremely difficult for anybody else to continue developing that application. So they must go on with that vendor, well knowing all they can expect from them is more troubles
So you have to live with the applications that are very difficult to operate, not easy to fix, and almost impossible to improve
Flink-ESB solves that situation in a very elegant way. It gives developers ability to see applications with the eyes of administrators, and administrators can see everything that developers see. Even people that do not work with the application will be able to say in 5 minutes whether the application is performing good, and if not, where is the problem
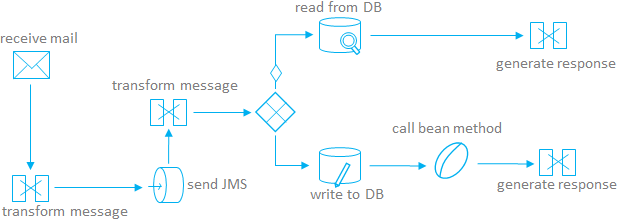
It is not just a bare statement. Everything in Flink-ESB is done by "Routes". All Flink-ESB applications are collections of "Routes" and "Beans", that the routes micht use. If the application is listening on HTTP URI "/processRequest" and does some processing with every received message - it is done by the route. If the application processes some batch data on regular basis and stores something in the database - it is done by the route
Every route consists of "Route Nodes", that are "Linked" with their neighbours. Every route node is responsible for some simple activity within the route: convert the message, split the message into array of smaller messages, decide where to send the message next (based on content of the message), send HTTP request to remote server, execute SQL statement etc. Links are responsible for passing message to the next route node, sometimes they also convert the message payload to some other format
So how all this information helps solving the problem described here?
Now imagine, you have possibility to see all the routes application consists of in a graphical form. For every route you see the performance statistic: how many times it was called, how many time it took to process the route, how many errors it has thrown, what kind of errors, when these errors were thrown, what were the messages that led to the errors
For every route you see what are the route nodes, how they are linked to each other, what every route node is doing. You can see performance statistic per route node. So you see where exactly within a route an error was thrown, what that particular route node is doing, what was an error, when it was thrown, and what was the message that led to an error
You cannot hide anything in Flink-ESB application. It should take no more then 5 minutes for anybody to check the application on all cluster instances and to say whether it is performing well. You usually do not even need to search within log files
It is easy for the developers to continue working on Flink-ESB application, or improving existing version, even if the application is very complicated and was initially created by another vendor
Develop different kinds of applications in Flink-ESB Editor
Flink-ESB Editor is the only tool you need to develop different kinds of applications. You don't need to install any other software, like Web- or Application Servers
Many components are available out of the box, allowing you to design applications with processes of any complexity. In most situations no coding at all (and hence no programming experience) is needed to create an application and design all its routes
You can develop multiple projects at the same time using the same Editor. You can start them, check the functionality, try integration with already installed applications
Test the Project in the Editor
Flink-ESB Editor allows you to test every part of the project
If you code java classes and define them as beans in the project, you can start the project and call every method of such beans, try different arguments, and see whether they return what you expect
Try calling Routes using different payloads, properties and headers
Flink-ESB Editor comes with preinstalled Flink-ESB Admin Console. As soon as you start one or multiple projects in the Editor, you can use Admin Console to verify behaviour of different parts of the projects
Projects started in the Editor behave exactly as applications installed in Flink-ESB Runtime Environment. Test interaction with other applications. See how application reacts on different internal or external events or outages. Simulate outages or mistakes to verify application's behaviour
Install the Project in Flink-ESB Runtime Environment
Installing Flink-ESB application into Flink-ESB Runtime Environment is very quick and simple task, and can be achieved in different ways
Just drop an application jar into a certain folder, where Flink-ESB Runtime will pick it up and install
or copy it to any folder you wish and use SSH console to deploy it from there
You can also use Flink-ESB Admin Console to administer installation tasks
Use Flink-ESB Admin Console to monitor
Flink-ESB offers API to get different monitoring statistics from the running instances. This API is accessible to authorised users over HTTP from any machine. Format of output is either JSON or CSV, which allows to extract portion of data you would like to use in your custom monitoring script
Flink-ESB outputs statistics about all instances running in the cluster, or just instances / applications / routes you would like to have statistics for
You can also use Flink-ESB Admin Console to have all performance, error and runtime statistics in user friendly graphical format
Let Flink-ESB show your application's weak spots and bottleneckes
Flink-ESB protocols every call. The longer you use it, the more information it will show you on strong and weak spots of your application
You can see what errors were thrown, what kind of errors and on what places within your business processes exactly
Flink-ESB collects also performance statistics and shows you this information on Admin Console. You can see exactly what processes are to slow, on what place they are slow, and what exactly is done on that place
Just let Flink-ESB collect the information, and check it on Admin Console every now and then
Fix the Project in the Editor and reinstall it
Use Flink-ESB Admin Console or SSH Console to redeploy updated application
No restart of the process instance is needed for this